
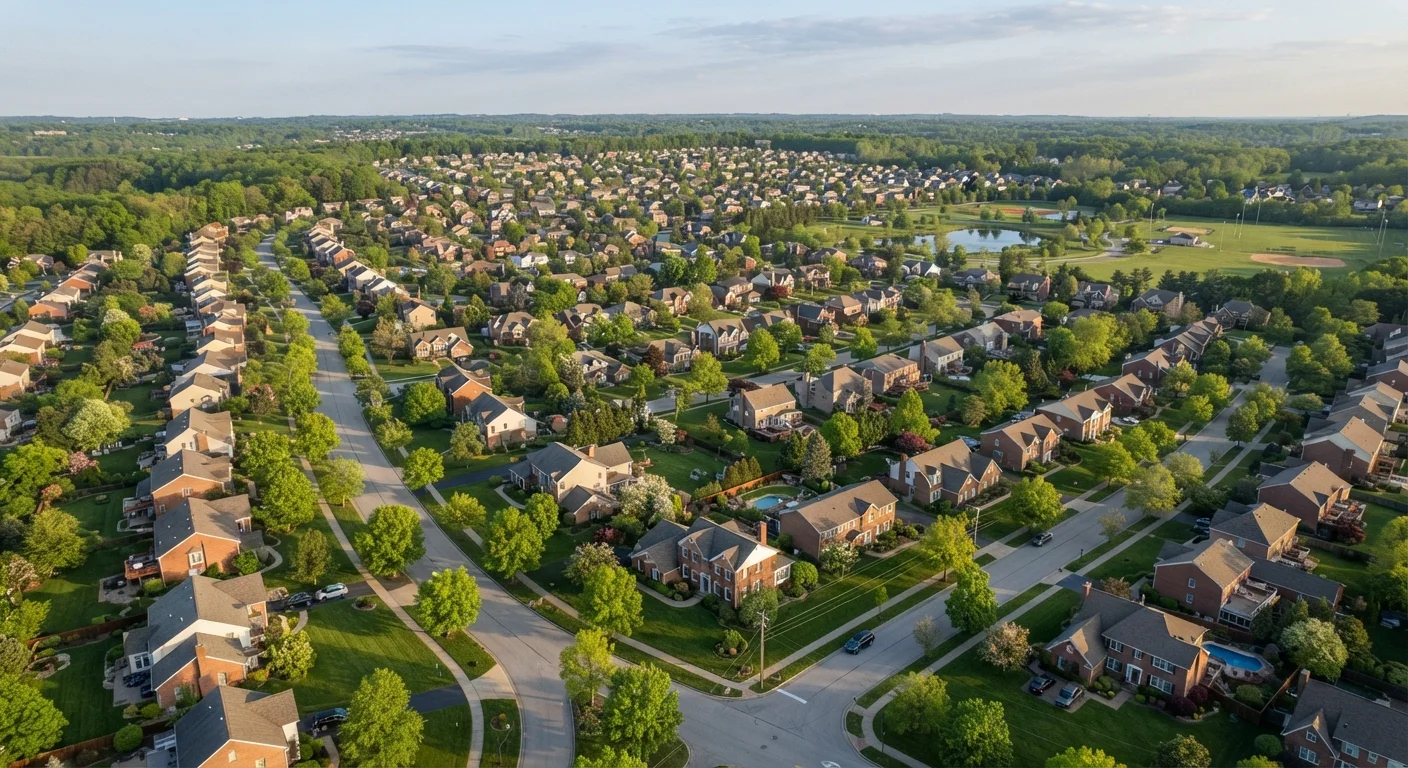
What the Housing Market Actually Is
The housing market is simply the ongoing exchange of homes between buyers and sellers - but what drives that exchange is anything but simple. Unlike a grocery store with fixed prices, home values emerge from the interaction of millions of decisions: whether to list a home, when to buy, how much to offer, and whether a lender will approve a loan.
At the national level, organizations like the National Association of Realtors track broad trends in sales volume, median prices, and inventory. But those national figures are composites. Your local market - defined by neighborhood, school district, or commute corridor - often behaves quite differently. A coastal city with constrained land and surging job growth operates under entirely different pressures than a Midwestern town experiencing population decline.
The housing market also intersects with the broader economy and with policy. Zoning laws limit where new homes can be built. Tax policy affects the cost of ownership. Federal Reserve decisions on interest rates shift how affordable borrowing is. None of these forces operates in isolation, which is why housing market movements rarely have a single clean explanation.
Supply, Demand, and Why They Move Prices
The most fundamental dynamic in any housing market is the relationship between inventory (homes available for sale) and buyer demand. When demand exceeds supply, sellers gain leverage: bidding wars emerge, homes sell quickly, and prices climb. When supply outpaces demand, buyers have more negotiating power, homes linger on the market, and prices soften or fall.
A commonly used measure of this balance is months of supply - how long it would take to sell every home currently listed at the current pace of sales. Industry convention treats roughly six months as a balanced market. Below four months typically signals sellers have the upper hand; above six months generally favors buyers. For a deeper look at how limited inventory shapes affordability, see our article on what low supply really does to prices.
New construction is the primary long-run release valve for supply constraints. When builders can profitably construct homes - and local zoning permits it - increased supply can moderate price growth over time. But construction takes years and faces its own cost pressures, so supply rarely catches up quickly to a demand spike.
Check Local Data, Not Just National Headlines
National housing statistics are useful for spotting broad trends, but they can mask wide variation at the city or neighborhood level. Before drawing conclusions about your local market, look at data specific to your ZIP code or metropolitan area. Real estate agents, county assessors, and many real estate data platforms publish local-level reports that are far more actionable than national figures.
The Role of Interest Rates and the Economy
Because most buyers finance their purchase with a mortgage, interest rates have an outsized effect on housing demand. When rates rise, monthly payments on the same loan amount increase - effectively pricing some buyers out of the market or pushing them toward less expensive homes. When rates fall, purchasing power expands and more buyers enter the market simultaneously.
Local economic conditions layer on top of rate effects. Steady job growth, rising incomes, and in-migration tend to fuel housing demand in a given area. Conversely, plant closures, population loss, or an over-reliance on a single employer can weaken demand even when national conditions look healthy.
Understanding the forces behind home price changes - from employment trends to construction costs - helps both buyers and sellers contextualize the numbers they see in any market report.
Rate Changes Affect Buyers and Sellers Differently
Rising mortgage rates reduce buyer purchasing power, which can slow sales activity and put downward pressure on prices. However, existing homeowners locked into lower rates may also be reluctant to sell and take on a new higher-rate mortgage - a dynamic sometimes called the 'lock-in effect.' This can keep inventory low even when demand softens, which complicates the usual supply-demand relationship.
How to Read What the Market Is Telling You
Once you understand the forces at work, the data becomes more legible. A few key metrics do most of the interpretive heavy lifting:
- Median sale price - the midpoint of all transaction prices in a period; less distorted by outliers than the average.
- Days on market (DOM) - how quickly homes are going under contract. A falling DOM signals rising competition; a rising DOM suggests cooling demand.
- Sale-to-list price ratio - whether homes are selling above, at, or below asking price. Ratios above 100% indicate bidding pressure.
- Months of supply - as discussed above, the clearest single gauge of buyer vs. seller conditions.
Monthly housing reports published by real estate data providers package these figures together. Learning to parse them quickly is a practical skill for anyone considering a purchase or sale. Our guide to reading a housing market report walks through exactly how to do that without a finance background.
Market conditions also shape negotiating dynamics in ways that go beyond price. In a competitive market, buyers may waive contingencies or shorten inspection windows - decisions with real financial and legal implications. Understanding whether you are operating in a seller's or buyer's market before you make an offer is one of the most practical steps any buyer or seller can take.
For renters wondering how all of this affects them, the connection is direct: when homeownership becomes less accessible, rental demand rises, which tends to push rents higher. The renting explained hub covers how these market forces filter into lease terms and tenant decisions.