
Why National Headlines Don't Tell Your Story
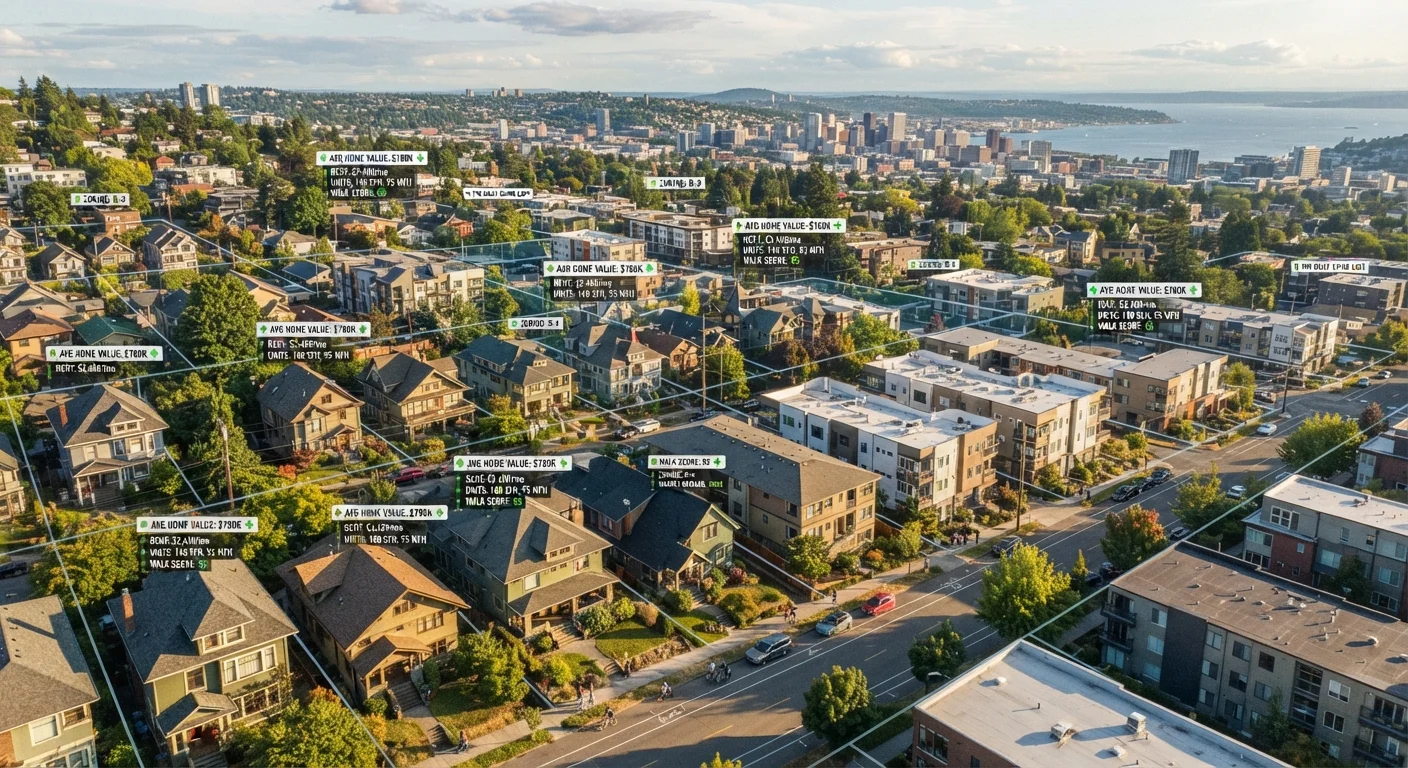
When the news reports that home prices dropped 3% nationally, or that inventory rose for the fourth straight month, those figures are constructed from hundreds of thousands of transactions across wildly different markets - suburban Texas, coastal California, rural Ohio, and everything in between. The result is a statistical average that may not reflect any single market with precision.
Consider what that average can hide: a national median price gain of 4% might include a rust-belt city where prices fell 8% and a Sun Belt suburb where they rose 15%. If you're shopping in either of those places, the national figure is essentially decorative. As our guide on how the housing market actually works explains, real estate is fundamentally local - shaped by employment, school districts, zoning laws, and migration patterns that vary enormously by geography.
This doesn't mean national data is useless. It establishes the macroeconomic backdrop - the direction of mortgage rates, the overall balance between buyers and sellers, and whether credit conditions are tightening. But it's the starting point, not the conclusion.
National vs. Local Data: What Each Measures
Understanding what each data type actually captures helps you use both more effectively.
| National Housing Data | Local Housing Data | |
|---|---|---|
| Geographic scope | Entire country or large metro areas | City, zip code, or neighborhood |
| Best use | Understanding macro trends and rate environment | Making specific buy, sell, or rent decisions |
| Data sources | NAR, Case-Shiller, Census Bureau | Local MLS, county recorder, city permits |
| Update frequency | Monthly or quarterly reports | Weekly or real-time in many markets |
| Risk of misleading readers | High - averages obscure local extremes | Lower - but small samples can distort |
| Accessibility | Widely reported in news media | Requires more active research effort |
National reports - from sources like the National Association of Realtors (NAR) or the S&P CoreLogic Case-Shiller Index - aggregate sales data across entire metro areas or the whole country. Local MLS (Multiple Listing Service) data, county recorder records, and municipal permit reports drill down to specific zip codes and even street segments. For a deeper look at how to evaluate what any given data point is actually telling you, see our piece on questions to ask before drawing conclusions from housing market data.
The Local Metrics That Actually Matter
When researching a specific market, a handful of indicators tend to be most revealing:
- Months of supply: The number of months it would take to sell all current listings at the present sales pace. Below three months generally signals a seller's market; above six typically favors buyers.
- Median days on market (DOM): How long homes sit before going under contract. A falling DOM indicates rising demand; a rising DOM may signal softening. Watch for this as an early warning signal - our article on signals that a housing market is shifting before headlines catch up covers this in detail.
- Sale-to-list price ratio: If homes routinely sell above asking price, competition is fierce. Ratios below 97% often indicate buyers have negotiating room.
- Price per square foot by neighborhood: Removes the distortion that comes from comparing a 900-square-foot condo to a 2,400-square-foot single-family home.
Where to Find Reliable Local Data
Your local MLS often publishes free monthly market reports broken down by city or zip code - check the website of your regional Realtor association. County assessor and recorder offices post actual transaction prices, which are more reliable than asking prices. The U.S. Census Bureau's American Community Survey also provides neighborhood-level housing data updated annually.
Local data is increasingly accessible. County assessor and recorder websites post transaction histories. Many MLS organizations publish monthly market reports for free. Your city or regional planning department often tracks permit activity, which is a leading indicator of future supply.
How to Use Both Layers Together
The most informed readers treat national data as context and local data as evidence. Start with the national picture to understand the interest rate environment and whether buyer demand is broadly rising or falling - forces explained in our overview of why home prices rise and fall. Then test that context against what's actually happening in your target market.
If national headlines say inventory is rising but your local MLS shows sub-30-day DOM and 5% above-asking closes, the local data overrides the headline for your purposes. Conversely, if national mortgage rate increases are pricing buyers out across the board, even a locally tight market may start to soften - making it worth monitoring how inventory shifts affect prices in your area over time.
One caution worth naming: even local data can be misread. A single month of rising sales prices doesn't establish a trend. Sample sizes in small zip codes are often too small to be statistically reliable. For a structured way to stress-test any figure you encounter, see our guide to reading a housing market report without a finance degree.
This article is for general informational and educational purposes only and does not constitute financial, legal, or real estate advice. Readers should consult a licensed real estate professional for guidance specific to their circumstances.